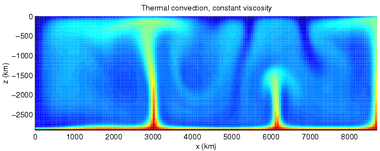
 This figure shows a calculation for thermal convection in the Earth's mantle. Colors closer to red are hot areas and colors closer to blue are cold areas. A hot, less-dense lower boundary layer sends plumes of hot material upwards, and likewise, cold material from the top moves downwards. - Wikipedia
 “Differentiation” is a term that has a little to do with geology, and a little with cosmology. In space, a giant ball of molten rock has a lot of convection going on inside, where heavier elements sink to the middle of the ball and stay molten due to the pressure, while lighter elements rise to the surface and cool at a faster rate. Differentiation is what created the Earth's core, mantle, and crust. As the Earth's cooled crust sat on top of a thick layer of flowing rock, the surface started to crack, dividing the crust into several tectonic plates that glide across the surface of the mantle from the convection it creates. These plates will eventually arrange themselves into several super continents that will break up and reform to make the continents we see today.
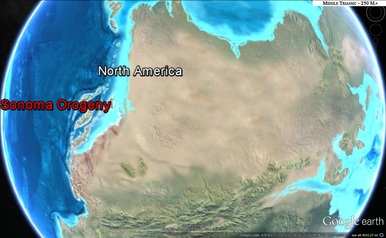 Middle Triassic Period, 250 million years ago. - Google Earth
 After many face changes over billions of years, hundreds of millions of years ago, all of the tectonic plates were joined into one large landmass, called Pangaea. One of these plates making up Pangaea, the North American Plate, was in the Midwestern corner of the super-continent, and the Pacific Plate was just a micro plate south of the enormous Farallon Plate. In time, convection caused volcanic activity that influenced the growth of the Pacific Plate. The growth of the Pacific Place pushed the Farallon Plate aside towards the west, which in turn, pushed up arcs of volcanic islands through the water at its edges. These islands drifted westward, before crashing into the north western corner of the North American Plate, breaking off from the Farallon, and forming the lands of Guatemala, Chipas, Oaxaca, Veracruz, Tlaxcala, Morelos, Guerrero, Mexico, Hidalgo, Michoacan, Queretaro, Guanajuato, Colima, Jalisco, Nayarit, Aguascalientes, San Luis Potosi, Zacatecas, Tamaulipas, Sinaloa, Durango, Nuevo Leon, Coahuila, Chihuahua, Sonora, Baja California, and Baja California Sur. The formation continues up to Arizona, New Mexico, Colorado, Wyoming, and Montana, up through Canada's Alberta, Northwest and Yukon territories as well as Alaska. Then south to the lands of British Colombia, Washington, Oregon and Upper California, which looked very different as the land was flatter than it is today.
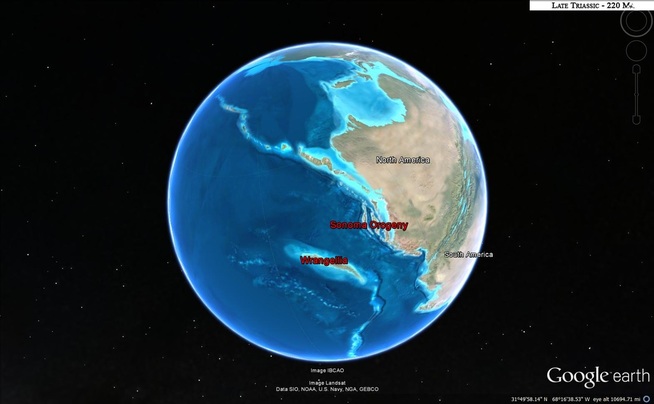
Late Triassic, 220 million years ago. The thin strips of land are being pushed into the continent, creating the future western lands of North America. - Google Earth
About 200 million years ago, a fault line appeared between the area of land that is now called "New Jersey" and the land that is now called "Morocco", marking the breakup of Pangaea and over time, the rift between the two lands separated more and more, eventually filling with water and giving birth to oceans: First the Tethys, then the Atlantic.
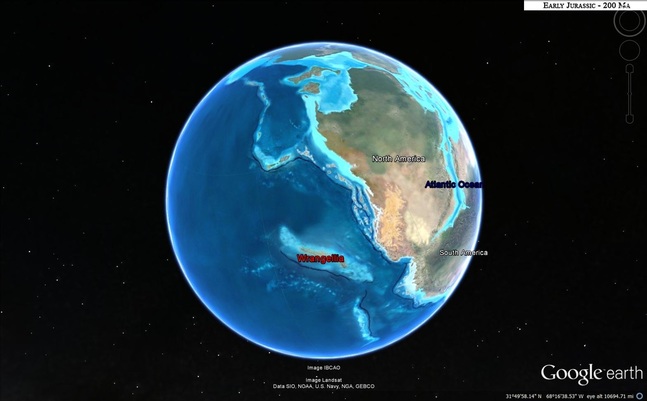
Early Jurassic, 200 million years ago. As more land is being added to continent, it begins to break up. - Google Earth
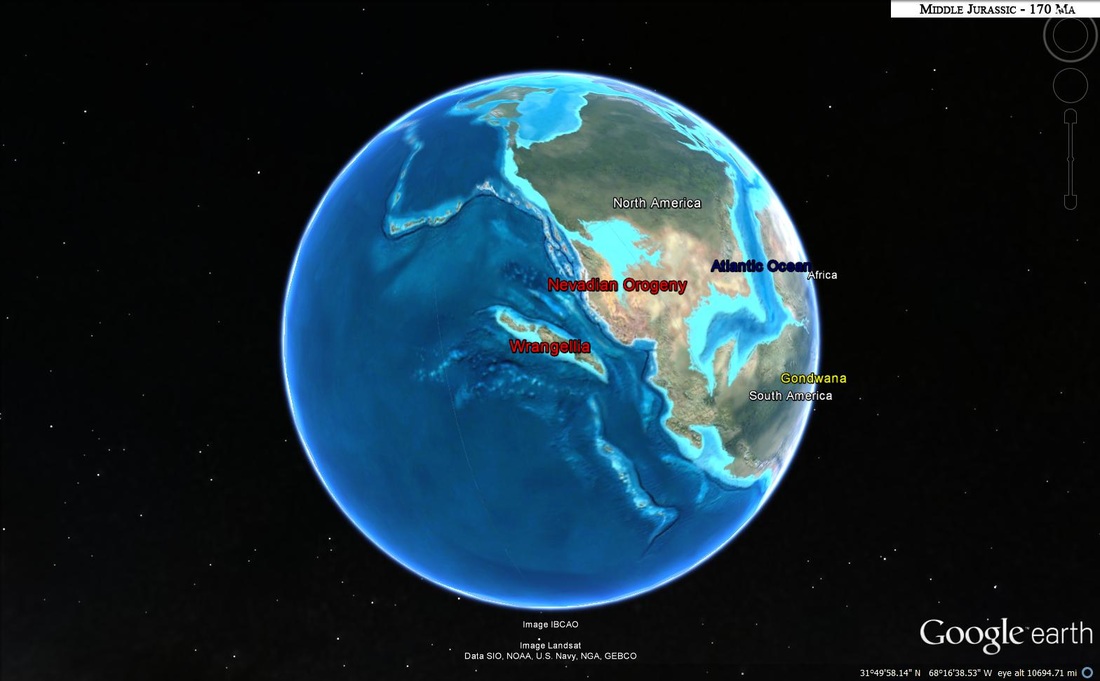
Middle Jurassic, 170 million years ago. The formation of the western lands of North America continue with the addition of Wrangellia, while the Atlantic Ocean continues to form. - Google Earth
 Late Cretaceous, 90 million years ago. - Google Earth
 While Pangaea was beginning to break up, the Triassic/Jurassic extinction event occurred. Though we don’t know how it occurred, the most reasonable explanation was some form of climate change. This eventually allowed the first evolving dinosaurs to begin their reign on the planet. At this time, ocean levels rose, the climate became hot and muggy from pole to pole, and the landmass that San Diego would one day rest upon was still underwater. Zooming back out into the continents, 90 million years ago, the Midwest of the North American Plate was covered by an ancient sea, separating the arcs of land to the far west from the lands to the east. Over time, rain and snowfall in the mountain regions allowed ancient rivers and beach tides to slowly erode away the high peaks, and mud and sediment from this erosion would be carried downstream into the ancient Paleo-Pacific Ocean. This made deep ocean beds shallower and shallower, and the high mountains eroded away. As sea levels later fell, it slowly exposed the lands and joined the east to the west once again. To the west, as sea levels periodically changed, Precambrian Era sands crept further and further west, and were accumulating in sedimentary layers, fossilizing many ancient species in the process.
The North American plate was drifting west, while the Farallon Plate, pushed by the growing Pacific micro plate, was moving east. Eventually, the Farallon Plate began to sink under the southwestern edge of the North American Plate, creating an off shore trench. The push also caused more underwater land between the trench and the coast to rise from the sea into a new arc of ancient volcanoes, which were actually the future eastern mountains of the Peninsular Region and Sierra Nevadas, and were much higher back at that time. The active volcanoes spread ash and sediment onto the Farallon Plate as it continued to dive underneath the North American Plate, deepening the trench, and heating the rocks under the land into granitic magmas, which were pushed up to the surface through the volcanoes. Mountain growth stopped about 90 million years ago, once the Farallon Plate was completely buried under the North American Plate, but volcanic activity didn't stop until about 28 million years ago, when subduction finally ended. These volcanoes probably became extinct at that time.
Rains and freeze/thaw cycles begin to take a toll on the rugged mountains of the Peninsular and the Sierra Nevadas, which began to get eroded by the rains. The land that would someday begin to form San Diego was born in the Jurassic Period, about 130 miles south-east of where San Diego presently lies, possibly close to where the Mexican city of San Luis Rio Colorado is today. About 75 million years ago, the sediment that eroded away from the Cuyamacca mountains was carried toward the Pacific by melting snow and rain waters. The stream cut a gorge through the Peninsular, creating a small delta that grew into a reletively flat coastal plane, and birthed the San Diego River. The land around the river then continued to be cut down to sea level. As sea levels rose and fell on the beaches, the sediments would layer up. Because the receding water was gradual, beaches would someday become inland Mesas.
Zooming back into the area, at the end of a Peninsula that stuck out of the middle north part of a large, ancient bay, is Cowles Mountain. It is the remnants of an ancient volcano separating future El Cajon and La Mesa, which were still submerged under water at that time.
K/T Boundary
 Late Cretaceous, 65 million years ago. - Google Earth
 65 million years ago, in an area about 3000 km east from San Diego, a 10 km wide meteor or comet barreled into the present day Yucatán Peninsula, causing global destruction. Earthquakes, volcanic eruptions, and mega tsunamis ensued. The debris from the blast reached Earth’s atmosphere and as it rained back down, it became superheated before impacting the surface as fireballs. This also raised the temperature of the atmosphere, ignited mass wildfires, dropped sea levels which exposed more land, and ultimately triggered the Cretaceous-Paleogene extinction event. The land that was forming into San Diego, being as close as it was to ground zero, probably took a good brunt of fire and brimstone and suffered a drop in sea levels. When the dust finally settled, three out of four living things on the planet had died, including most of the dinosaurs. This left a thick layer of ash all over the world, which was later buried by sediment, and compacted into what geologists call the K-Pg Boundary.
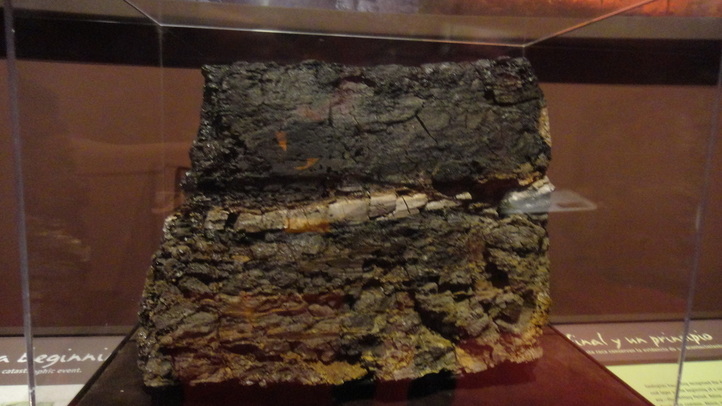
K-Pg Boundary rock. Contains a layer of Iridium that once blanketed the globe, but was then buried and fossilized. On Display at the San Diego Natural History Museum.
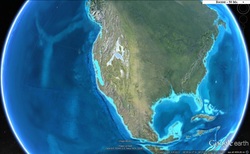 Eocene, 50 million years ago. - Google Earth
 Back in San Diego, by about 50 Million years ago, a small system of rivers was beginning to form at this time which continued to deposit and distribute sediment into new land. One of the rivers up north was the Santa Ysebel which carved out San Pasqual Valley in the process of draining into the San Dieguito River, which carved through the land before emptying into the Pacific Ocean. As the ocean levels continued to rise and fall, the sediment at the mouth of the San Dieguito River was pushed southward by winds and water currents, giving an initial shape to the curving coast and creating its first modern peninsula, later to be called Crown Point. Looking south of Crown Point, the sediments that flowed from the Cuyamacca Mountains, was forming the lowlands that will someday form Point Loma. Still influenced by the rise and fall of ocean levels, winds and currents, erosion on the coastal edges caused pieces of the raised land to fall off of the edges and sink into the ocean, further shaping the coast and creating the cliff edges of Del Mar, La Jolla, and Point Loma, these changes are still evident today. The southern portion however, was still underwater.
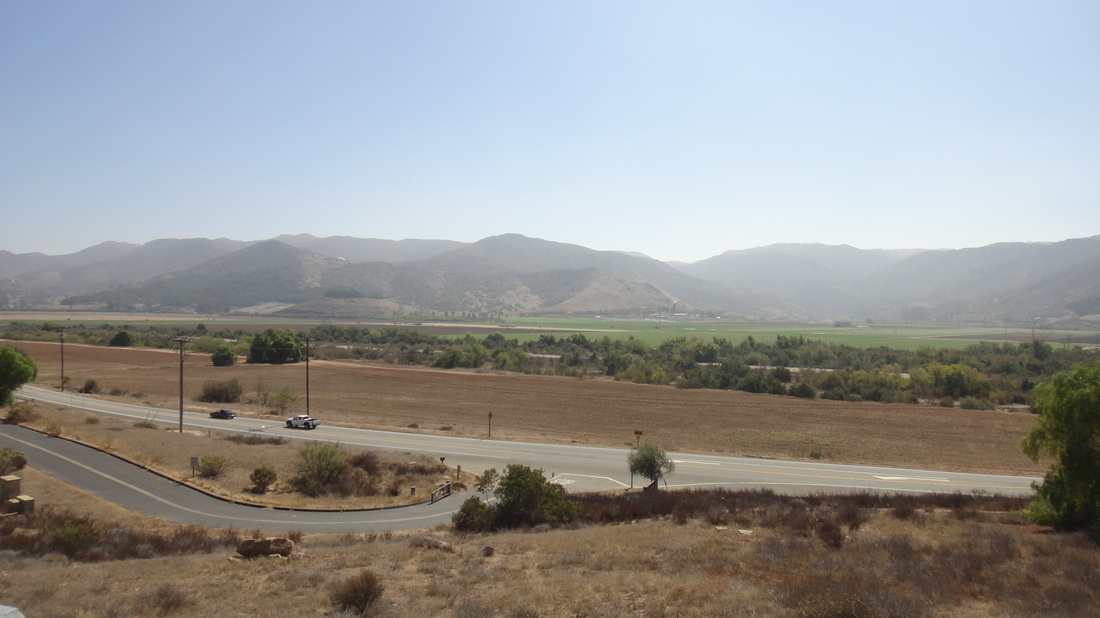
San Pasqual Valley as it is today.
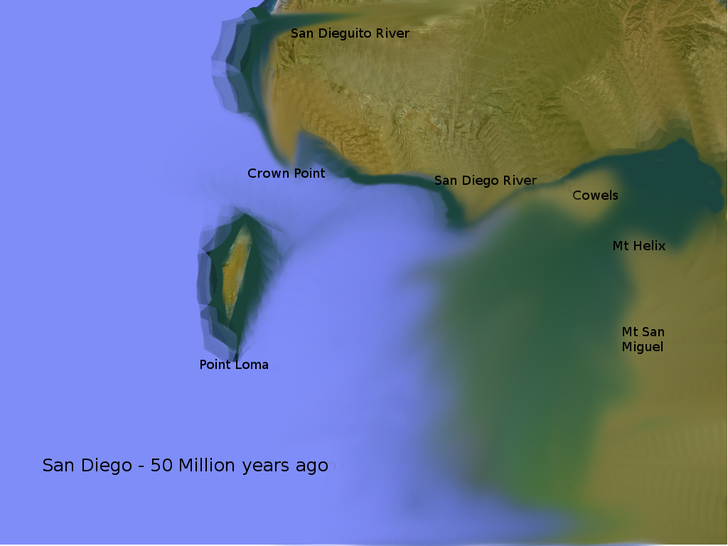
My bad attempt at what San Diego may have looked like 50 million years ago.
By 30 million years ago, the Pacific and North American Plates finally met and started to grind, giving birth to the 800 mile long San Andreas Fault. This also bent the land upward to the west of the San Andreas Fault, but sunk the land where the fault was at, creating the future Salton Sink. Far to the west, where San Diego is, many other smaller faults were created in the process, like the Rose Canyon Fault, and the La Nacion Fault system. About 6 million years ago, because the Pacific Plate continued to grind north, the entire coast of California shifted up the same way, slowly tearing a rift valley between Baja-California and the Mexican mainland, which filled up with ocean water to become the Gulf of California. The ancient Gulf of California reached all the way up north to future Indio, California until ocean levels fell again.
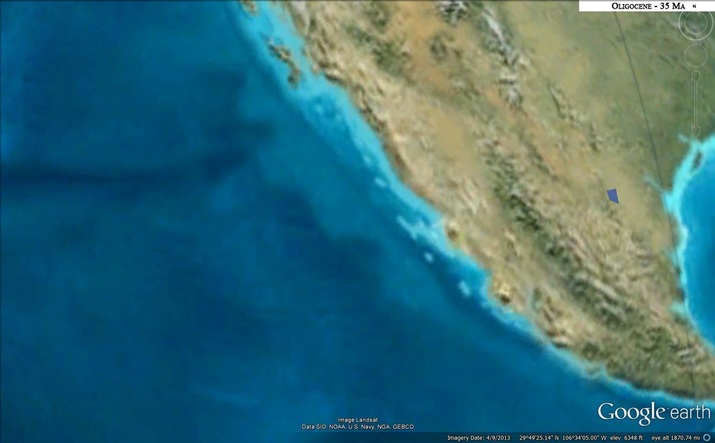
Oligocene, 35 million years ago. Notice that Baja California is still connected to the Mexican mainland. - Google Earth
Meanwhile, the Rose Canyon fault started to shift the northern coast of San Diego to the northwest. The shifting faults warped the coastal topography of San Diego, raising Mount Soledad and Point Loma high from the waters. The land to the east and south of Point Loma stayed underwater, making it an island and creating an enormous bay from La Jolla, down to Encinada, Mexico and reached as far east as La Mesa. The La Nacion Fault is actually a system of faults that lower in elevation as you move westward from the mountains to the beach where present day Chula Vista and National City sit. Those lands were still under this enormous ancient bay.
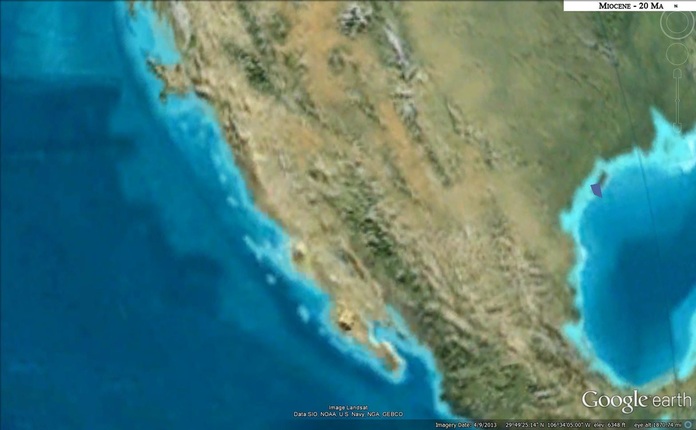
Miocene, 20 million years ago. Notice the Baja Peninsula beginning to rip away. - Google Earth
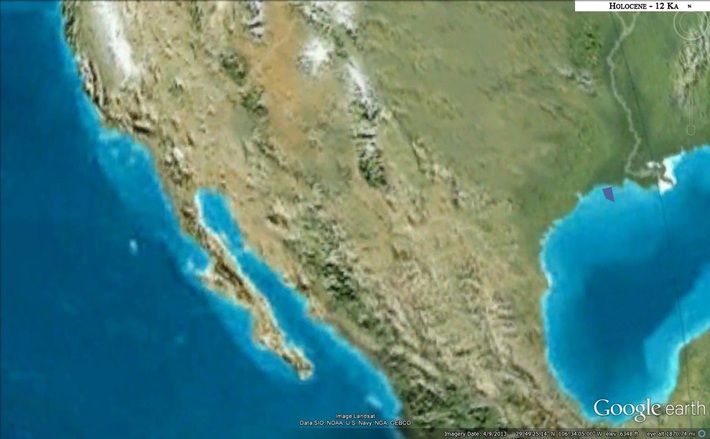
Holocene, 12 thousand years ago. Baja Peninsula will continue to move north. - Google Earth.
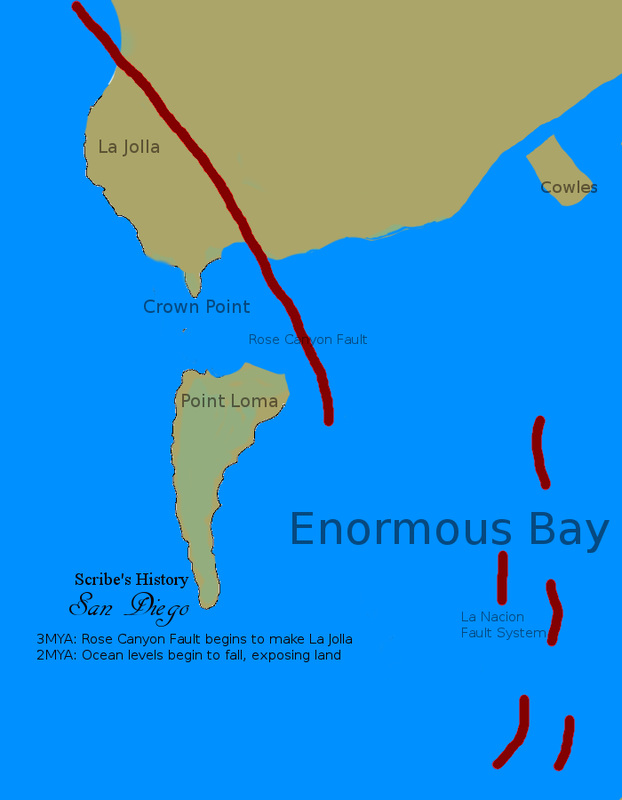
An attempt to draw how San Diego looked 3 million years ago. Red lines are approximate fault lines that shaped San Diego.
Sources:
San Diego County Geological History
https://www.youtube.com/watch?v=FZp0i_hIkWM
The Rise and Fall of San Diego
https://www.youtube.com/watch?v=-drjJoRGfAk
Geologic Map of San Diego
http://www.quake.ca.gov/gmaps/RGM/sandiego/sandiego.html
From the San Diego Natural History Museum
https://www.sdnhm.org/archive/research/paleontology/sdgeol.html
 RSS Feed